The Player Game Analysis Report provides users with detailed data on game performance, such as earnings, usage, and aggregation per player.
The report is based on the GameEndTimeUTC of bets.
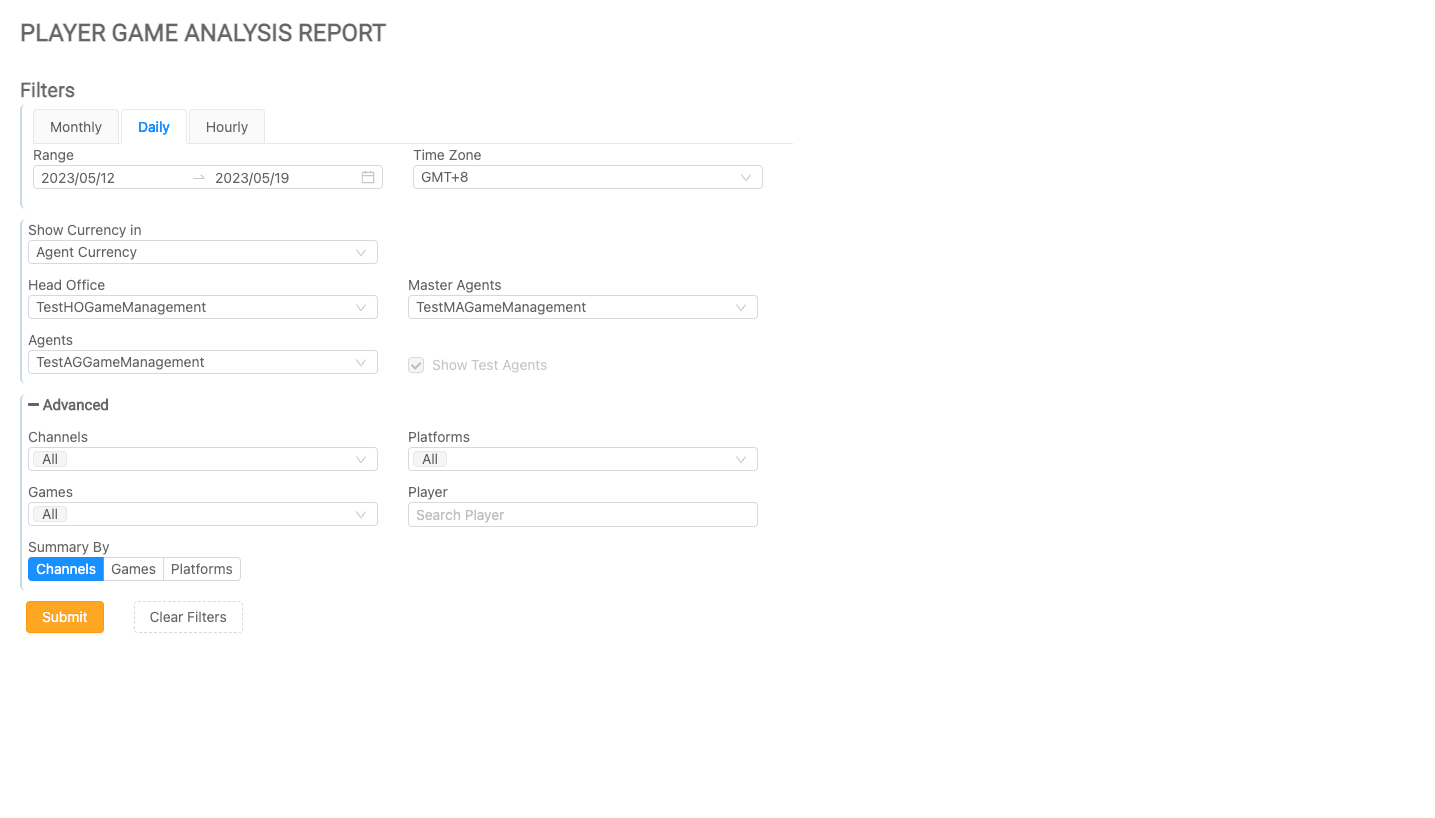
Filtering the Player Game Analysis Report
Use the filters to refine your search criteria. Click the Submit button to view the results, or click Clear Filters to reset and start over.
|
|
Filter |
Description |
|---|---|
|
Range |
The date and time range can be specified using the provided parameters. Hourly - The maximum search range is 3 days within the last 30 days. Daily - The maximum search range is 90 days within the last 24 months. Monthly - The maximum search range is 3 months within the last 24 months. |
|
Time Zone |
Changing the time zone will impact the time zone displayed in the results. Setting the time zone enables Master Agents and Head Offices to view financial information from all Agents in one time zone. The default time zone will be based on the chosen time zone in the Settings page. If the user does not modify the time zone, the default time zone will be set to GMT+0. |
|
Show Currency In |
Users can select a currency in which to view the data from their reports. The Player Currency is the currency that was originally used for the transactions, while the other currencies in the list will convert the data to the chosen currency. The conversion rate from the previous day will be used to convert the current day's data. |
|
Entity Filters |
Users can apply filters to view the data relevant to the entity. Only one value can be chosen from the drop-down menu. For menus with only one option, the option will be automatically displayed and selected. The Agents drop-down menu is accompanied by a checkbox that allows the user to filter the client's test agents (marked in red). By default, the Show Test Agents checkbox is unchecked. This option will be disabled for clients that do not have test agents on the MG+ system. |
|
Channels |
This drop-down menu can be used to filter the report by one, several, or all channels. |
|
Platforms |
This drop-down menu can be used to filter the report by selecting one, several, or all platforms. |
|
Games |
This drop-down menu can be used to filter the report by selecting one, several, or all games. |
|
Player |
The results can be filtered for a single player's data by searching for them using the text box. |
|
Summary By |
Users can choose how to summarize the report, which will determine the structure of the report. |
Functionality of the Player Game Analysis Report
To adjust the filters for resubmission, click Filter (this may be displayed as an icon or as a link labeled +Filter).
Clicking on the Export button will provide the user with an Excel .CSV file of the table summary.
Daily Aggregation
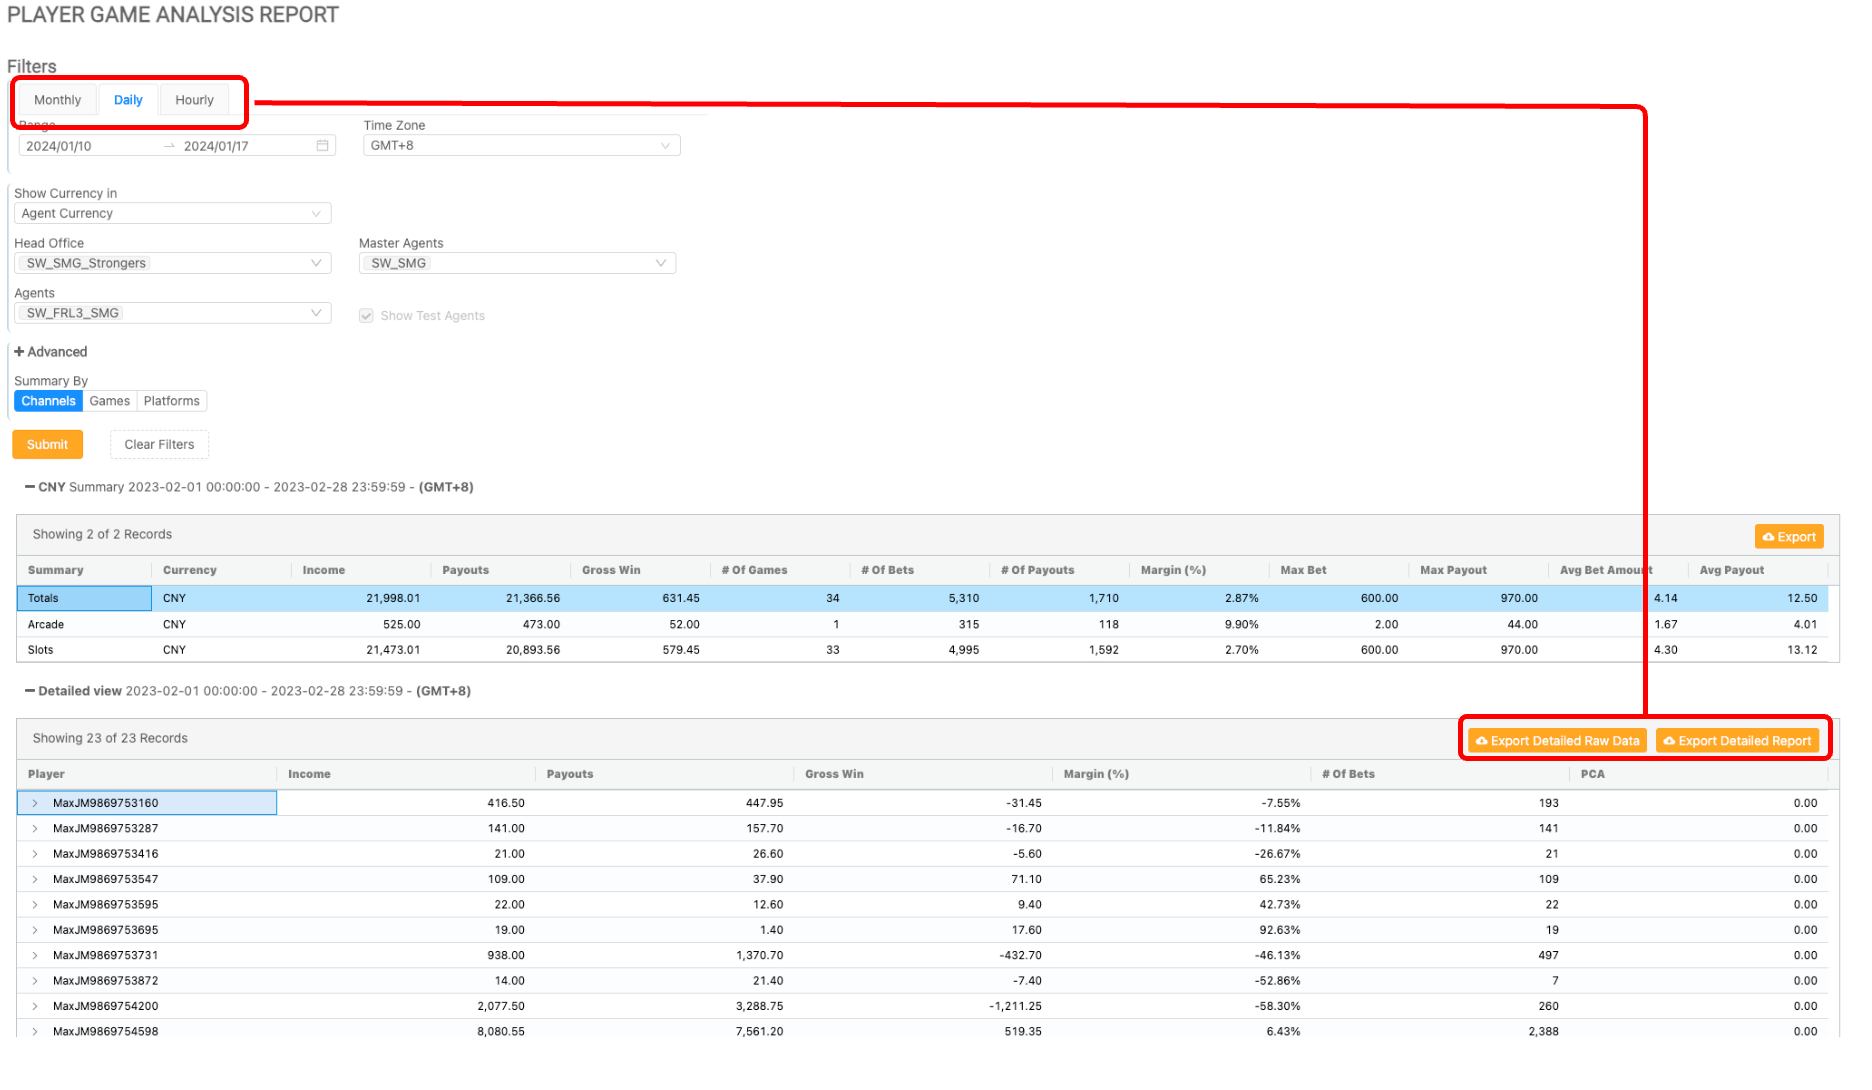
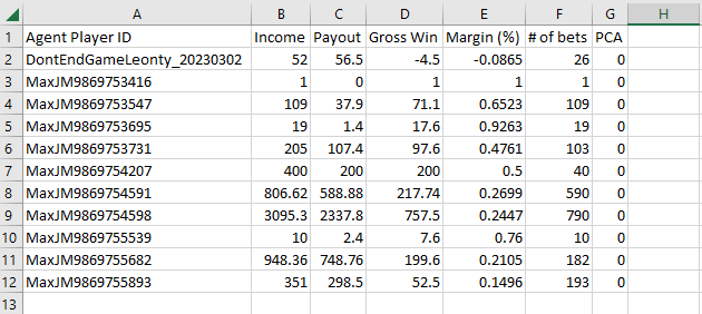
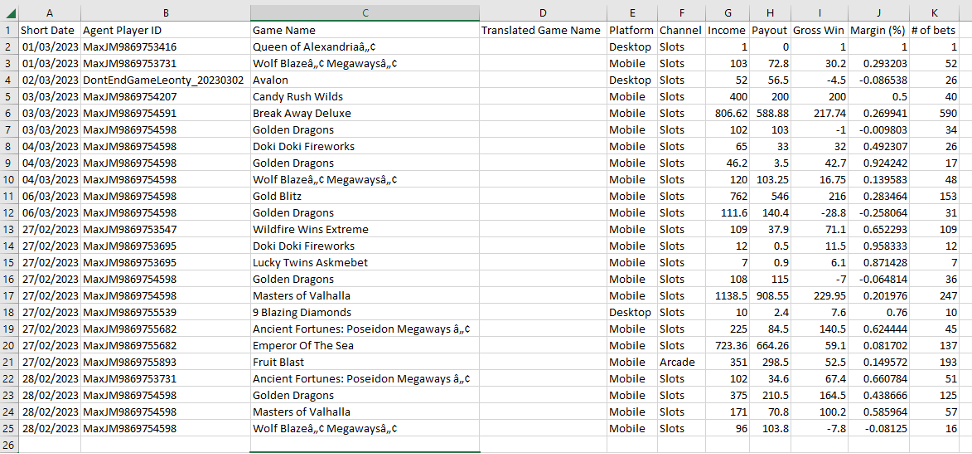
If the report is filtered using the Daily option for Range, then the report will be aggregated daily. This allows the user to export the data with the Export Detailed Raw Data option, where the user can export raw data of each player per game per platform per date. This option is not available for the Hourly or Monthly filters. All range options allow the user to utilize the Export Detailed Report option, where the data is aggregated by the player ID.
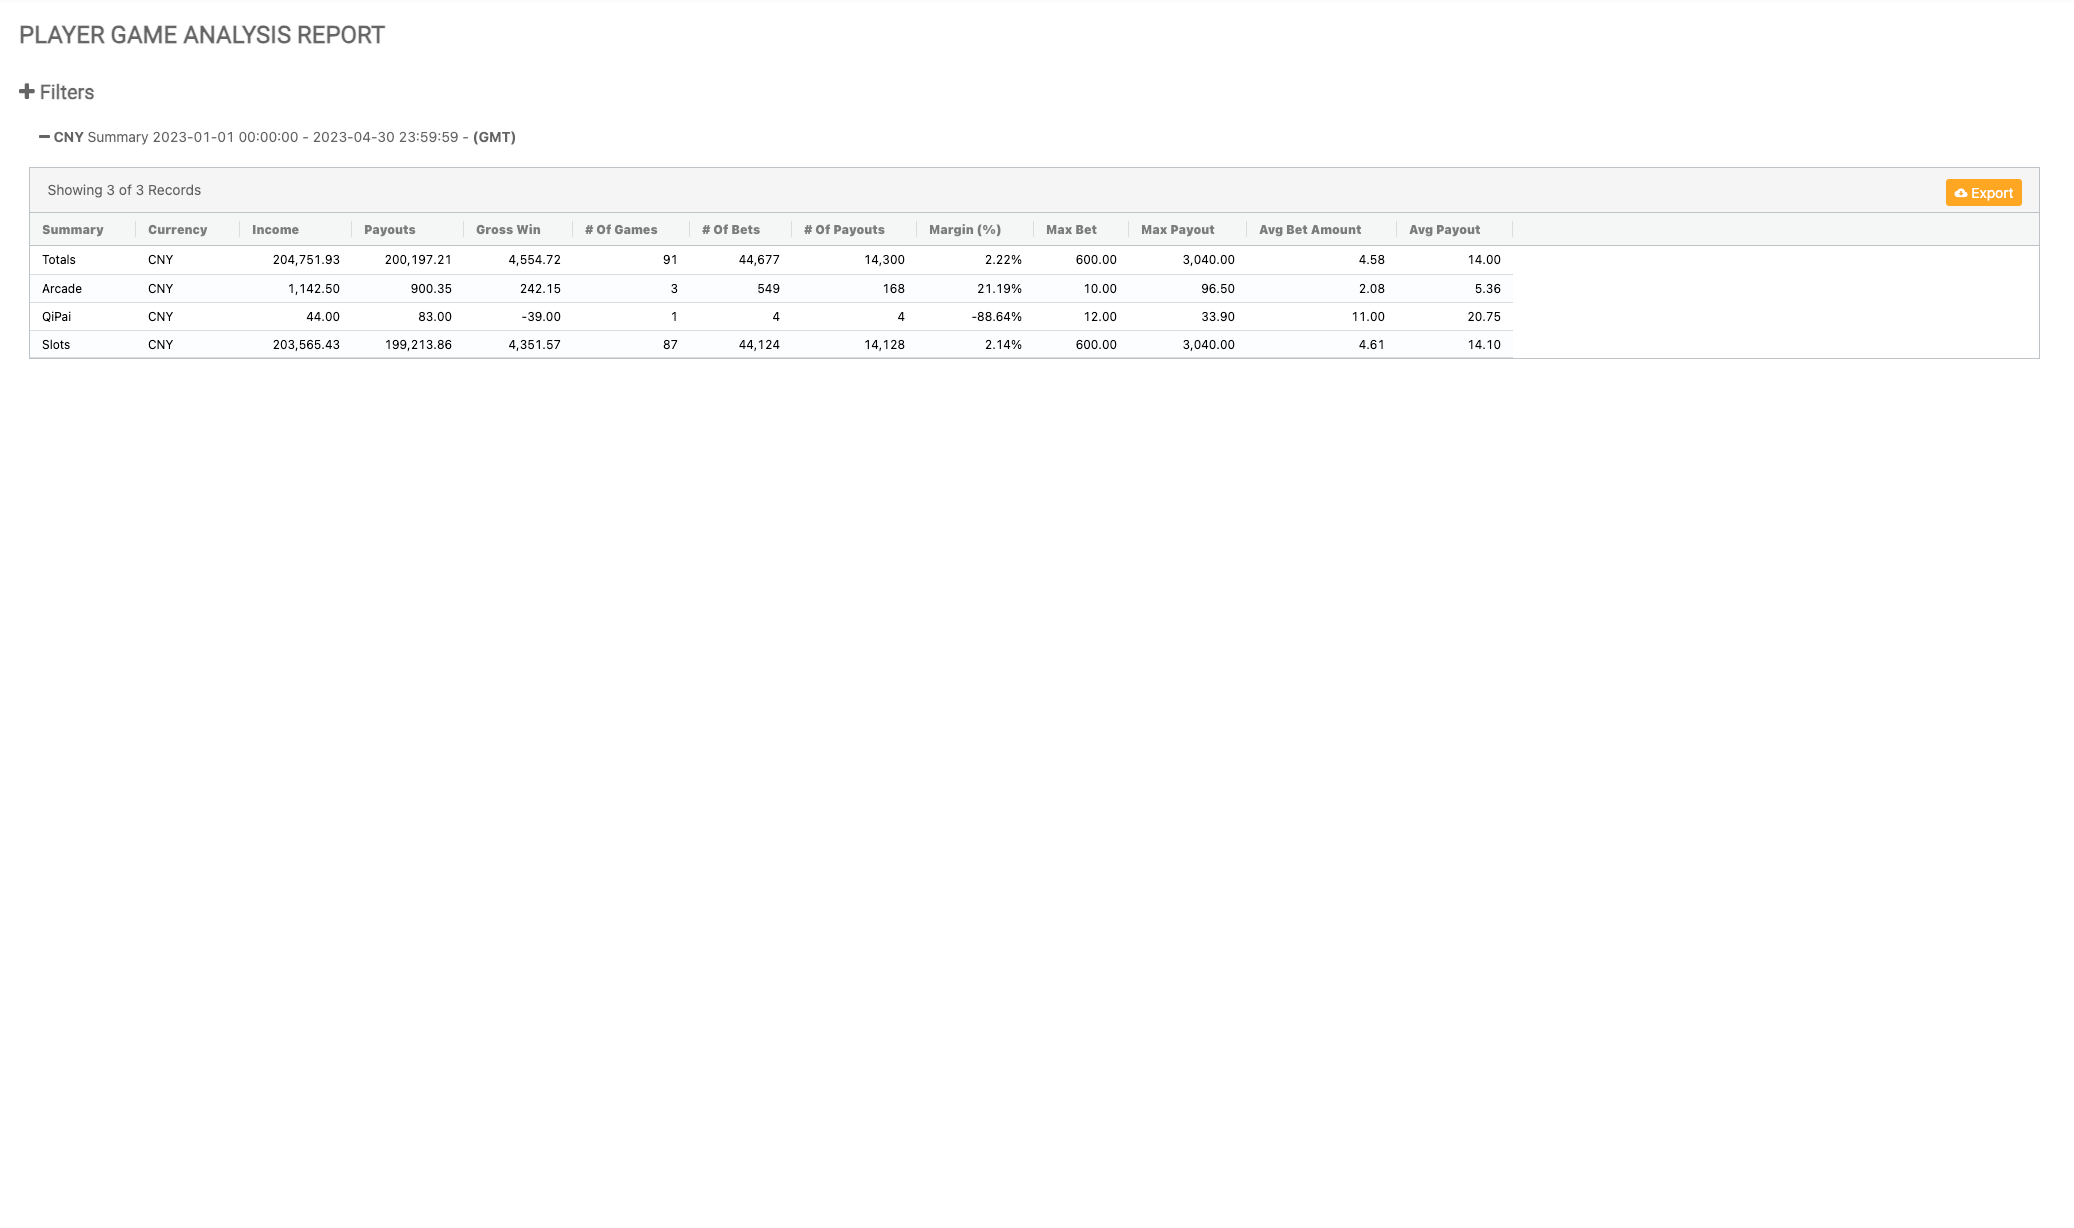
Player Game Analysis Report Table One
Once the report has been submitted, the Summary section will be displayed based on the chosen Summary By option.
If Show Currency In is set to Player Currency, the summary section of the report will be divided by currency type, which is relevant for clients dealing with multiple currencies.
|
|
Column Name |
Description |
|---|---|
|
Summary |
The selected summary view as set by the filters. |
|
Currency |
The selected currency as set by the filters. |
|
Income |
Sum of bets made. |
|
Payouts |
Income minus payouts. |
|
Gross Win |
Income minus payouts. |
|
Number of Games |
Number of games played. |
|
Number of Bets |
Number of bets made. |
|
Number of Payouts |
Number of payouts made. |
|
Margin |
Gross win over income; calculated as a percentage. |
|
Max Bet |
The highest bet that was made. |
|
Max Payout |
The highest payout that was made. |
|
Average Bet Amount |
The average of all bets that were made. |
|
Average Payout |
The average of all payouts that have been given. |
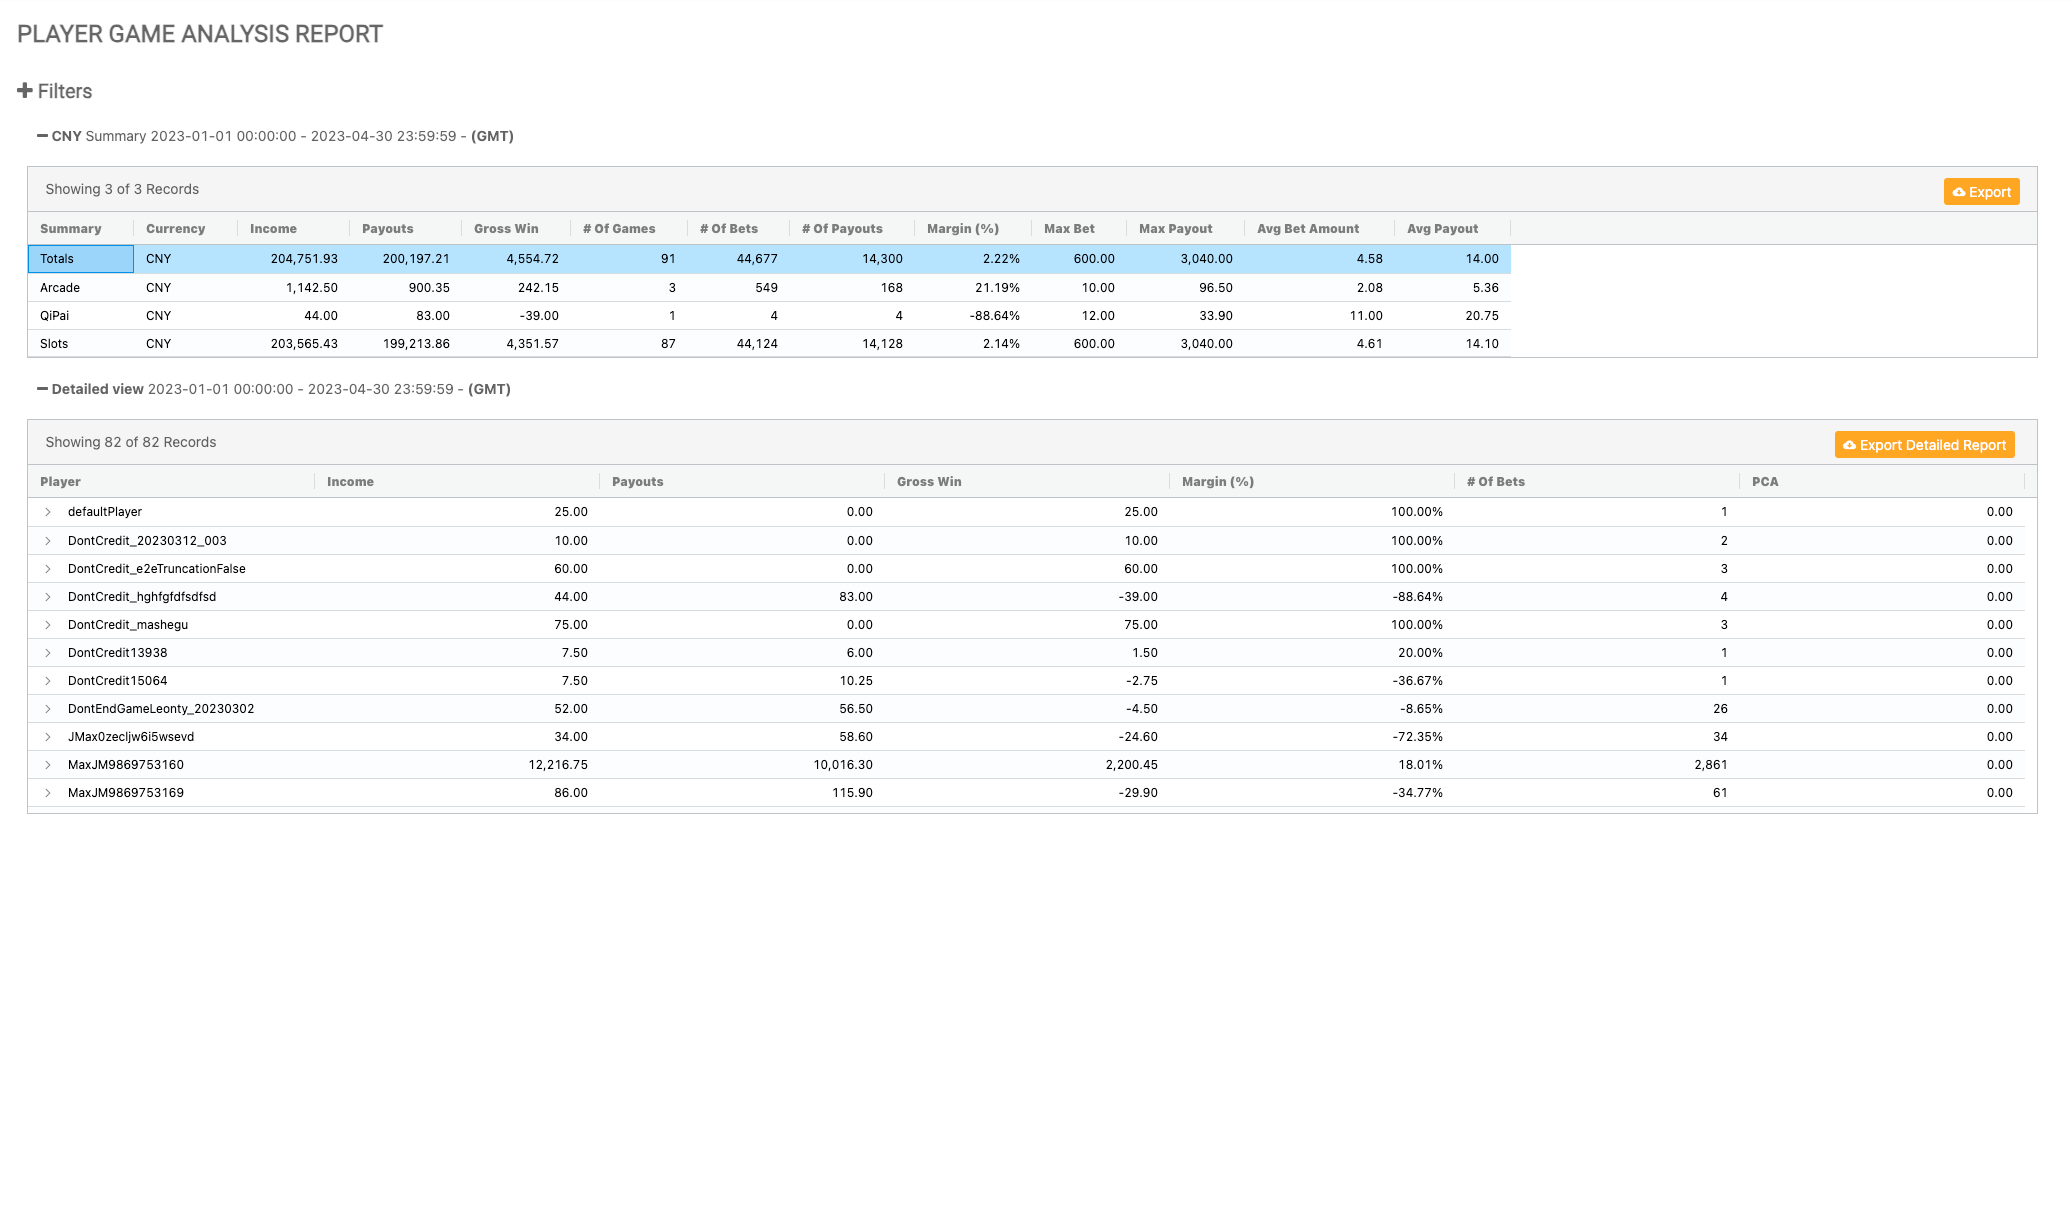
Player Game Analysis Report Table Two
To access the detailed view table, a specific row can be selected from the summary level of the report. Clicking on one of the rows will open the details.
|
|
Column Name |
Description |
|---|---|
|
Player |
The player ID of the player. |
|
Income |
Sum of bets made. |
|
Payouts |
Income minus payouts. |
|
Gross Win |
Income minus payouts. |
|
Margin |
Gross win over income; calculated as a percentage. |
|
Number of Bets |
Number of bets made. |
|
PCA |
Progressive Contribution Amount - the aggregation of how much the player has contributed to the progressive amount. |
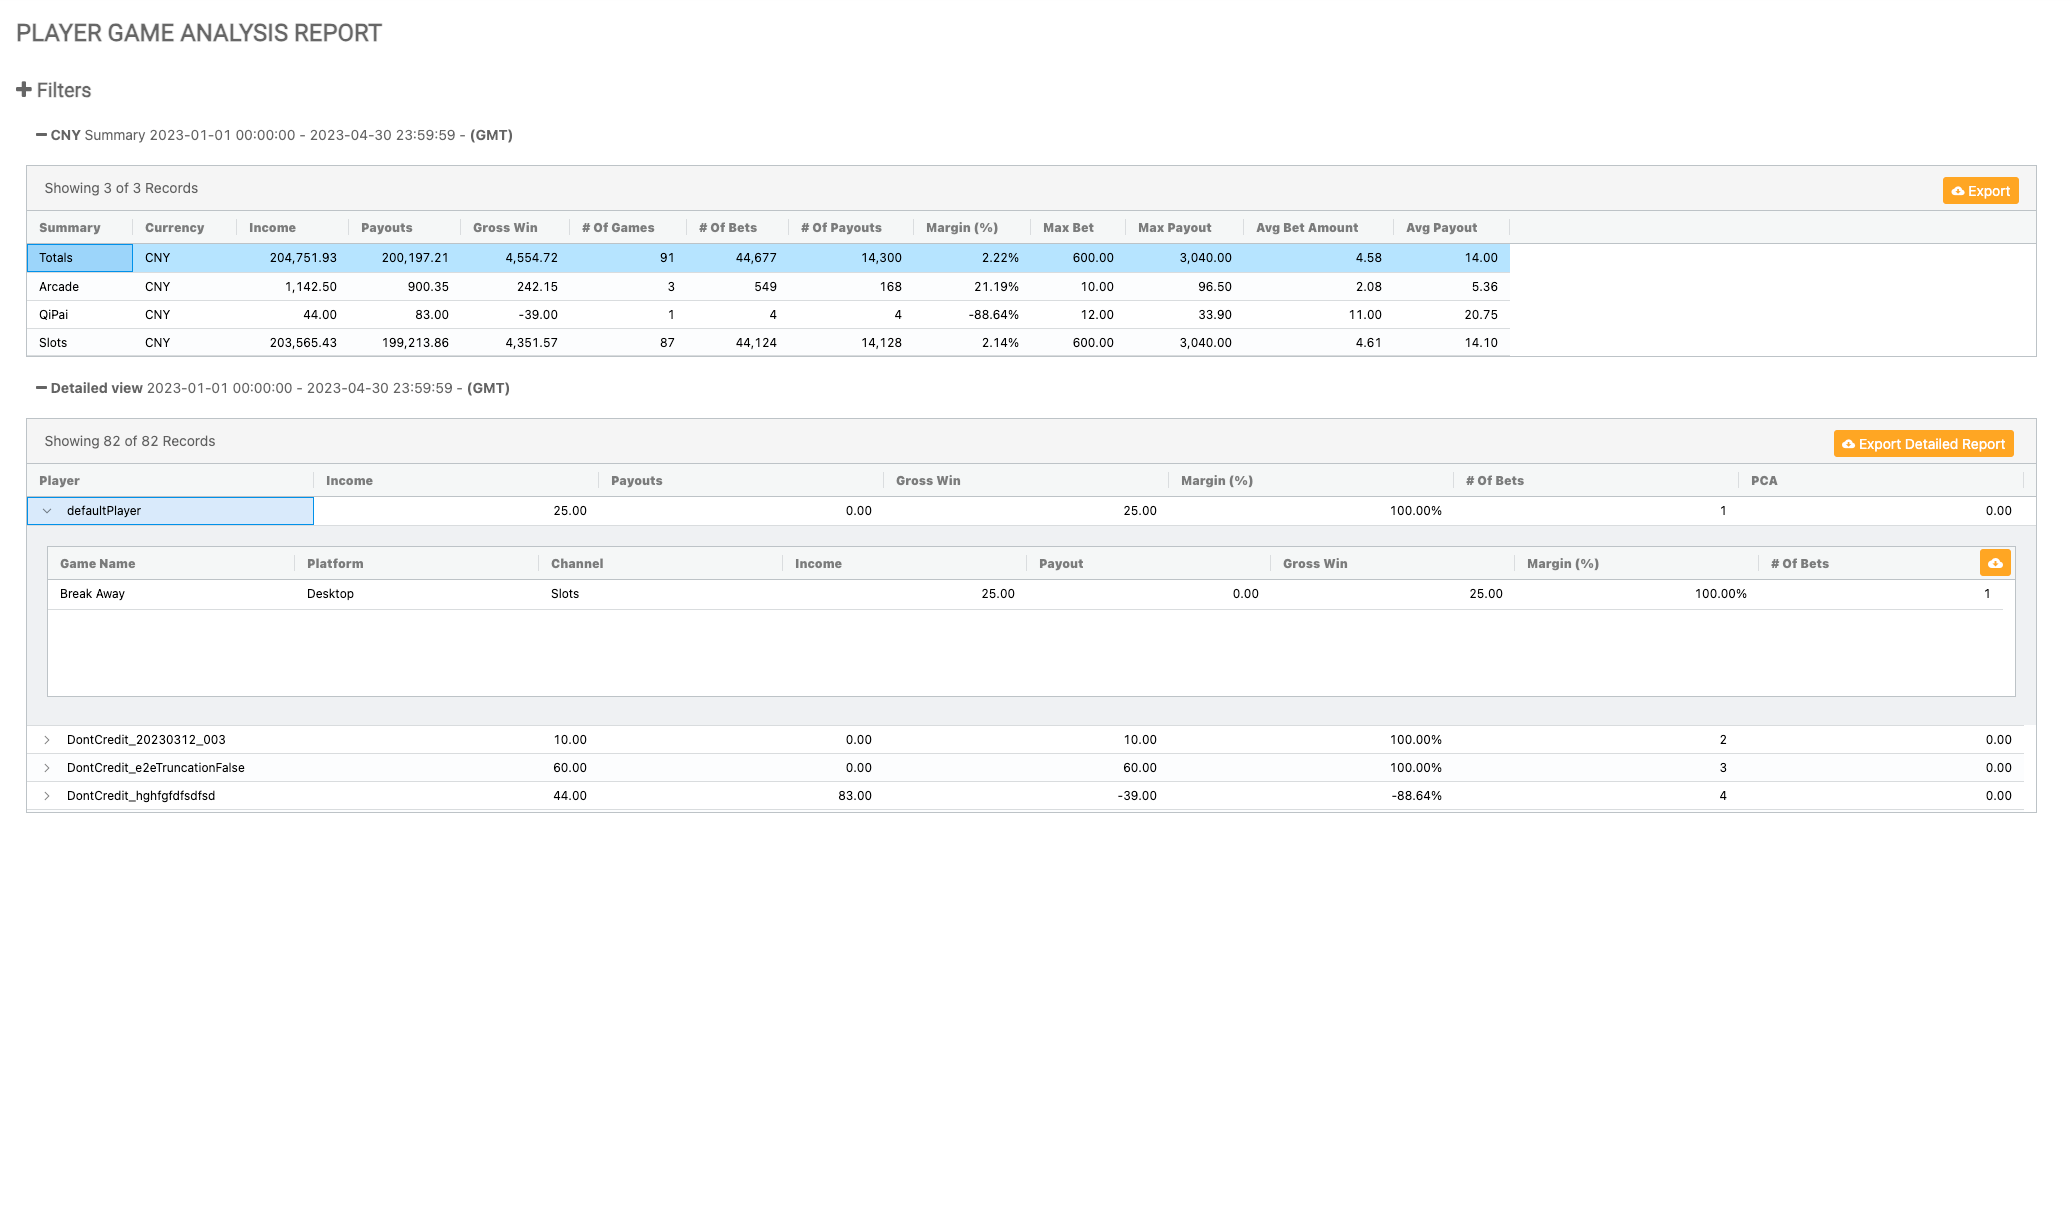
Player Game Analysis Report Table Three
By clicking the arrow on the left side of one of the rows in the Detailed View section (table two of the report), a third table with additional aggregations will be revealed.
|
|
Column Name |
Description |
|---|---|
|
Game Name |
The name of the game. |
|
Platform |
The platform that the game was accessed from. |
|
Channel |
The game channel accessed by the player. |
|
Income |
Sum of bets made. |
|
Payout |
Income minus payouts. |
|
Gross Win |
Income minus payouts. |
|
Margin |
Gross win over income; calculated as a percentage. |
|
Number of Bets |
Number of bets made. |