Users can use filters to customize the information displayed on their Dashboard.

|
Clicking on the Refresh button will update the Dashboard’s data. |

|
Clicking on the Open Filter button will enable users to adjust the data displayed on the Dashboard by selecting from the available filter options. |

|
Once the Open Filter button is clicked, it will be replaced with a Close Filter button, which will then hide the filter options when clicked. |
|
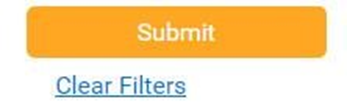
By clicking the Submit button, the Dashboard's data will be refreshed based on the selected filters. |
|
By clicking the Clear Filters link, the filter options will be reset. |
Filtering the Dashboard
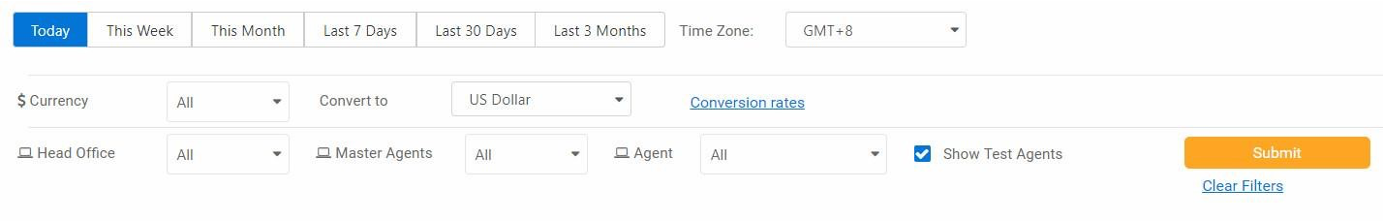
Date Range Picker
When users select one of the date range options, the Dashboard's data will be updated.
|
Today |
Data will be displayed from 00:00 until the last closing hour, in hourly aggregation, and compared to the same time range from the day before. |
|---|---|
|
This Week |
Data will be displayed from Monday starting at 00:00 until the last closing hour, in daily aggregation, and compared to the same time range from one week prior. |
|
This Month |
Data will be displayed from the first day of the month starting at 00:00 until the last closing hour, in daily aggregation, and compared to the same time range from one month prior. |
|
Last 7 Days |
Data will be displayed from the past 6 full days starting at 00:00 until the last closing hour, in daily aggregation, and compared to the same time range from 8-14 days prior. |
|
Last 30 Days |
Data will be displayed from the past 29 full days starting at 00:00 until the last closing hour, in daily aggregation, and compared to the same time range from 31-60 days prior. |
|
Last 3 Months |
Data will be displayed from the past 2 full months starting at 00:00 until the last closing hour, in monthly aggregation, and compared to the same time range from 6 months prior. |
|
Filter |
Description |
|---|---|
|
Time Zone |
Changing the time zone will impact the time zone displayed in the results. Setting the time zone enables Master Agents and Head Offices to view financial information from all Agents in one time zone. The default time zone will be based on the chosen time zone in the Settings page. If the user does not modify the time zone, the default time zone will be set to GMT+0. |
|
Currency |
Users can use the Currency drop-down menu to filter data by selecting one or more currencies. The default setting is to display all available currencies. This is not a conversion option; the list of currencies corresponds to the currencies that can be used by the agent. |
|
Convert To |
Users can select from a fixed list of currency options to determine the currency in which their dashboard's data will be displayed. The currency chosen on the Settings page will be the default currency. The most recent conversion rate listed in the Conversion rates link will be used. |
|
Conversion Rates |
Next to the Convert to drop-down menu, users can access the conversion rate list by clicking the Conversion rates link. |
|
Entities Filter |
Users can apply filters to view the data relevant to the entity. The default option is set to All. The Agents drop-down menu is accompanied by a checkbox that allows the user to filter the client's test agents (marked in red). By default, the Show Test Agents checkbox is unchecked. This option will be disabled for clients that do not have test agents on the MG+ system. |