This page provides information on how to interpret each type of graph displayed on the Dashboard.
The Dashboard provides 3 types of Key Performance Indicators; line graphs, doughnut graphs and bar graphs.
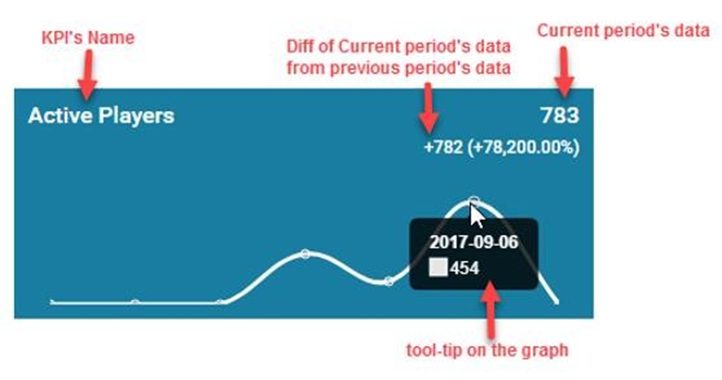
Line Graphs

|
Deposits Count |
Number of deposit events. |
|
Withdrawals Count |
Number of withdrawal events. |
|
Bets Count |
Number of bets. |
|
Active Players |
Number of players that made a bet per aggregation according to the chosen time range. |
|
Deposits |
Deposits amount. |
|
Withdrawals |
Withdrawals amount. |
|
Income |
Bets amount. |
|
New Players |
Number of players that made their first ever deposit. |
|
GrossWin |
Total GrossWin. |
|
Channels |
All MG+ games are assigned to channels, which are referred to as Game Groups (slots, live games etc). Please be advised that the GGR Provider KPI has been changed to the GGR Channel KPI. Gross gaming revenue (GGR), also called game yield, is a key metric used by gambling and betting companies. It reflects the difference between the amount of money players wager minus the amount that they win. |
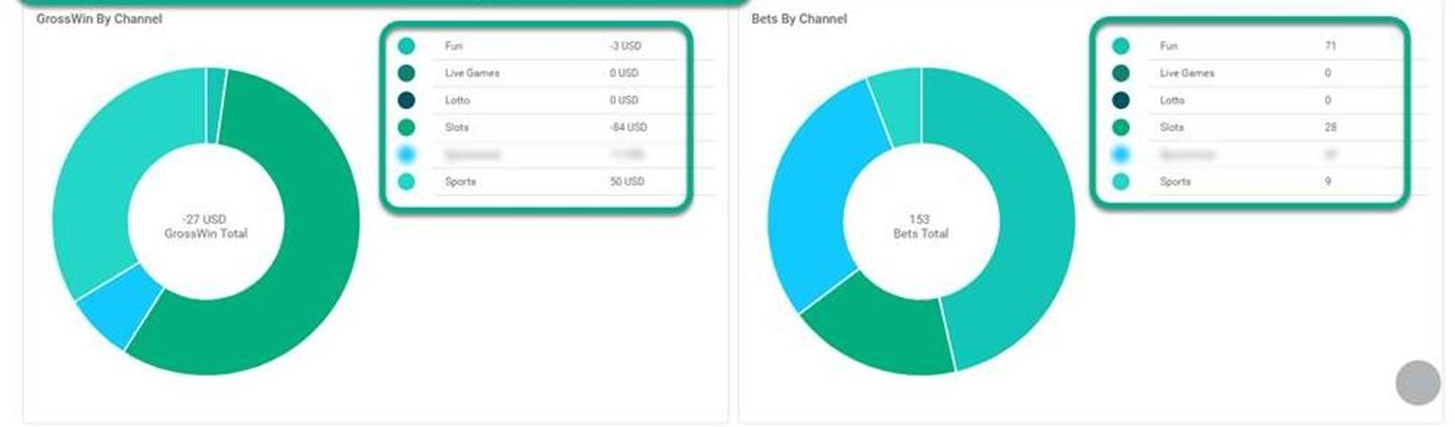
Doughnut Graphs
|
GrossWin By Channel |
Breakdown of gross wins by channel out of the total gross win. |
|
Bets By Channel |
Breakdown of bets count by channel out of the total bet. |
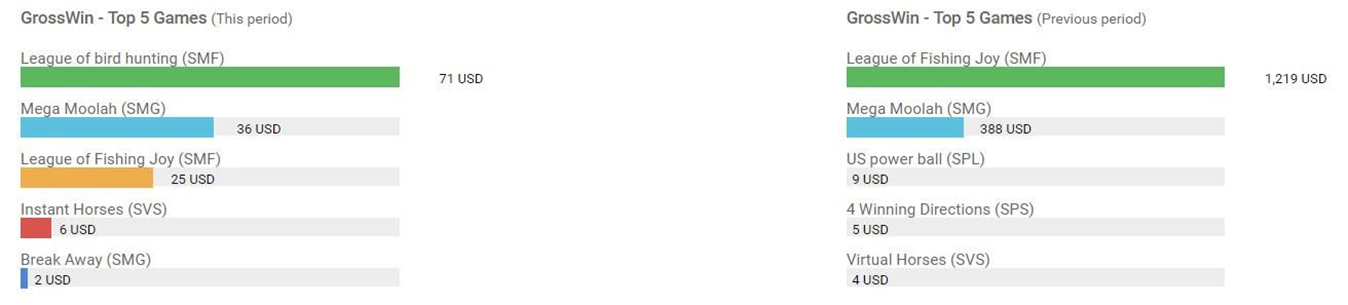
Bar Graphs
|
GrossWin - Top 5 Games (This period) |
Shows the top 5 leading GrossWin performing games in the current time period. |
|
GrossWin - Top 5 Games (Previous period) |
Shows the top 5 leading GrossWin performing games in the previous time period. |